 Call us: (732) 520-3386
 Email us: info@redsurgetechnology.com



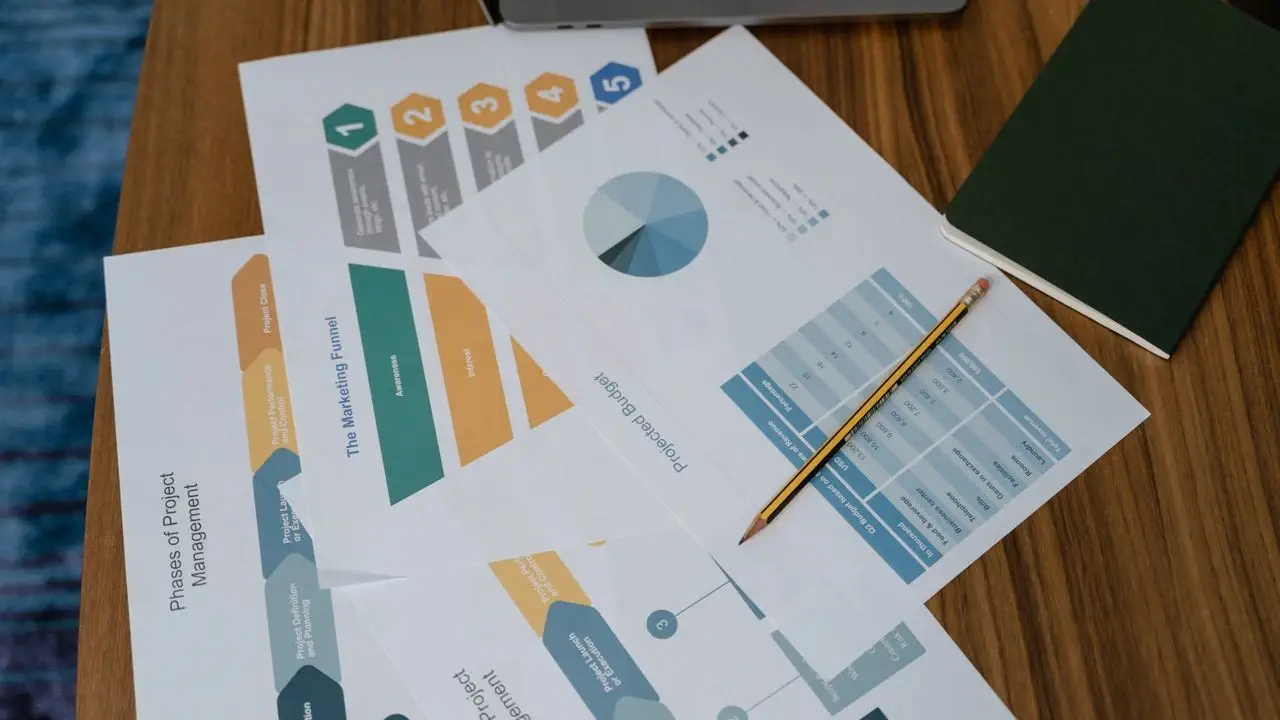
If you're building a project management dashboard, a scheduling tool, or an internal workflow system, a Gantt chart is almost inevitable. It's the clearest way to visualize tasks on a timeline—dependencies, progress, milestones, and resource allocation all in one view. But implementing a Gantt chart from scratch is a massive undertaking. Drag-and-drop scheduling, critical path calculations, zoom levels, dependency arrows, virtualization for large datasets—the feature list grows fast.
Fortunately, you don't have to build it yourself. The React ecosystem has several mature Gantt chart libraries, ranging from lightweight open-source options to feature-complete commercial suites. I've used several of them in production and evaluated others for client projects. This guide will help you pick the right one for your needs.
We'll cover the top React Gantt chart libraries in 2026, compare their performance, licensing, and feature sets, and provide a decision framework to match you with the right tool. If you've read our React chart library comparison, you know the general charting landscape. Gantt charts are a different beast—they combine timeline visualization, task management, and complex interactions in one component.
What Makes a Gantt Chart Library Different from a Charting Library
Before we dive into specific libraries, let's clarify why Gantt charts require specialized tools.
A standard chart library like Recharts or Victory renders static visualizations: line charts, bar charts, pie charts. You pass data, it draws shapes. Interactions like tooltips are nice-to-haves.
A Gantt chart is an interactive project management interface. It needs:
- Task bars with start dates, end dates, progress, and dependencies.
- Drag-and-drop to move or resize tasks.
- Dependency arrows (finish-to-start, start-to-start, etc.) drawn between tasks.
- Hierarchical task lists with expand/collapse for parent tasks and subtasks.
- Timeline navigation with zoom levels (hours, days, weeks, months, quarters).
- Critical path analysis (often a premium feature).
- Virtualization to handle thousands of tasks without performance collapse.
- Localization for date formats and language.
These are not generic chart features. They're project management features. That's why a dedicated Gantt library exists, and why using a charting library to fake a Gantt chart is a path to frustration.
For a deeper look at general charting libraries and their performance characteristics, see our React charting library performance benchmarks. But for Gantt-specific needs, read on.
The Open-Source Contenders
SVAR React Gantt: The Native React Performance Leader
SVAR React Gantt (formerly SVAR Gantt) is a native React component—not a wrapper around a vanilla JavaScript library. It's built specifically for React's rendering model and TypeScript workflows, and it's MIT-licensed with a PRO edition for advanced features.
What sets it apart:
- Native React architecture. No wrapper layer means tighter integration, better performance, and fewer compatibility issues.
- Virtualization for large datasets. Handles thousands of tasks efficiently, with a demo showing 10k tasks. The SVAR performance benchmark shows it wins in loading speed, CRUD operations, and live updates[reference:0].
- TypeScript support. Full types for tasks, dependencies, and configuration.
- React 19 compatible. Keeps up with the latest React releases.
- Drag-and-drop interface. Add, edit, and organize tasks directly on the timeline.
- Customizable time scales. Hours, days, weeks, sprints, or custom stages.
- Flexible grid columns and filtering.
import { Gantt } from "@svar-ui/react-gantt";
import "@svar-ui/react-gantt/all.css";

export default function MyGantt() {
  const tasks = [
    {
      id: 20,
      text: "New Task",
      start: new Date(2024, 5, 11),
      end: new Date(2024, 6, 12),
      duration: 1,
      progress: 0.5,
      type: "task",
    },
    {
      id: 47,
      text: "Project Phase",
      start: new Date(2024, 5, 12),
      end: new Date(2024, 7, 12),
      duration: 8,
      progress: 0.2,
      parent: 0,
      type: "summary",
    },
  ];

  return <Gantt tasks={tasks} />;
}
What's in the PRO edition? Work-time calendars, critical path, baselines, resource planning, auto-scheduling, split tasks, export to PNG/PDF/Excel/MS Project, and undo/redo[reference:1]. If you're building a serious project management tool, the PRO edition is worth the investment.
When to choose it: You're building a React-first application and want a native component with excellent performance, TypeScript support, and a clear upgrade path to advanced scheduling features. It's my top recommendation for most React projects.
gantt-task-react: The Lightweight, TypeScript-Ready Option
gantt-task-react is a popular open-source library that provides an interactive Gantt chart component with TypeScript support. It's simpler than SVAR and ideal for projects that need a clean, functional Gantt chart without advanced scheduling algorithms.
What sets it apart:
- Lightweight and easy to integrate. Install via npm, import the component, pass your tasks.
- TypeScript support. Full type definitions for tasks and configuration.
- Responsive design. Works on mobile and tablet.
- Dependency management. Supports finish-to-start and other dependency types.
- Localization. Date formats for various languages.
- Event handling. Callbacks for task clicks, date changes, progress changes, and deletion.
import { Gantt, Task, ViewMode } from 'gantt-task-react';
import 'gantt-task-react/dist/index.css';

const tasks: Task[] = [
  {
    start: new Date(2024, 1, 1),
    end: new Date(2024, 1, 5),
    name: 'Design',
    id: 'Task 0',
    type: 'task',
    progress: 45,
  },
  {
    start: new Date(2024, 1, 5),
    end: new Date(2024, 1, 10),
    name: 'Development',
    id: 'Task 1',
    type: 'task',
    progress: 20,
    dependencies: ['Task 0'],
  },
];

export default function MyGantt() {
  return <Gantt tasks={tasks} viewMode={ViewMode.Day} />;
}
What to watch out for: The core library hasn't been as actively maintained as SVAR in recent years, though community forks (like chiliman-oOo/gantt-task-react) have added performance improvements and enhanced customization. For new projects, SVAR is the safer long-term bet. But if you need a simple, working Gantt chart quickly, gantt-task-react gets the job done[reference:2].
When to choose it: You need a straightforward Gantt chart with basic dependencies and don't require advanced scheduling features. It's a good choice for internal tools and MVPs.
Frappe Gantt: The Minimalist SVG Option
Frappe Gantt is a simple, elegant Gantt chart library that renders as SVG. It's not React-specific—it's vanilla JavaScript—but there are React wrappers available (like react-frappe-gantt). It's MIT-licensed and very lightweight.
What sets it apart:
- Minimal dependencies. No heavy frameworks, just SVG rendering.
- Clean, modern look. The default styling is polished.
- Easy to customize. CSS-based styling.
- Good for simple timelines. Task bars, progress, dependencies, and drag-and-drop.
What to watch out for: The React wrappers are less maintained than the core library, and it's not built for large datasets. SVG rendering means performance degrades with hundreds of tasks. It's best for small projects or simple visualizations. As the Webix comparison notes, Frappe Gantt is best for "lightweight timeline-focused" use cases, not enterprise scheduling[reference:3].
When to choose it: You need a simple, good-looking Gantt chart for a small number of tasks and prefer a lightweight dependency.
The Commercial Contenders
Bryntum Gantt: The Feature-Complete Enterprise Option
Bryntum Gantt is widely considered the most feature-complete Gantt chart component on the market. It's built with vanilla JavaScript and TypeScript and integrates with React via a wrapper. It's commercial, with pricing starting around $680 per developer for the Gantt component alone[reference:4].
What sets it apart:
- Most feature-complete. Critical path, baselines, resource management, auto-scheduling, task constraints, calendars, and more.
- Excellent performance. The SVAR benchmark shows Bryntum shares first place for scrolling speed and is competitive across all metrics[reference:5].
- Professional support and documentation. Enterprise-grade support with SLAs.
- Integrations with backend systems. APIs for saving and loading data.
What to watch out for: The price. For small teams or indie projects, $680+ per developer is steep. The bundle size is also substantial (~500 KB min), which adds weight to your application. And the React wrapper isn't as idiomatic as a native React component like SVAR.
When to choose it: You're building an enterprise-grade project management application where the feature set justifies the cost. If you need critical path, resource leveling, and advanced scheduling, Bryntum is the gold standard.
DHTMLX Gantt: The Mature Workhorse
DHTMLX Gantt has been around for years and is one of the most mature Gantt libraries available. Like Bryntum, it's vanilla JS with a React wrapper. It offers a Community Edition under the MIT license, making it an attractive option for budget-conscious teams.
What sets it apart:
- Mature and battle-tested. Years of production usage.
- Handles large datasets. Can efficiently manage 30,000+ tasks[reference:6].
- Community Edition is MIT-licensed. Free for commercial use with attribution.
- Broad feature coverage in the Community Edition: milestones, dependencies, drag-and-drop scheduling, smart rendering.
- Clear upgrade path to PRO for resource management, auto-scheduling, and critical path.
What to watch out for: The PRO edition is expensive (critical path alone is $1,299/dev, auto-scheduling is $2,995/dev)[reference:7]. The React wrapper, while functional, is not a native React component. The API surface is larger and requires more configuration than lightweight alternatives.
When to choose it: You want a production-ready Gantt component that can start free and scale into enterprise features as your product grows. It's an excellent middle ground between lightweight open-source libraries and expensive commercial suites.
Syncfusion React Gantt Chart
Syncfusion's React Gantt Chart is part of their larger UI component suite. It's commercial, though Syncfusion offers a free community license for small companies and individuals.
What sets it apart:
- Microsoft Project-like interface. Familiar to project managers.
- Modular architecture. Import only the features you need, keeping bundle size down.
- Integration with the Syncfusion ecosystem. If you're already using Syncfusion components, the Gantt chart integrates seamlessly.
- Comprehensive feature set. Task dependencies, resources, baselines, critical path, and more.
What to watch out for: The React wrapper is less performant than native React components like SVAR, according to the SVAR benchmark. The licensing cost can be high for larger teams, though the community license is generous.
When to choose it: You're already using Syncfusion components or need a Microsoft Project-like experience with a familiar API.
Performance Benchmark: What the Numbers Say
The SVAR team published a performance benchmark comparing six popular React Gantt libraries across loading speed, scrolling, CRUD operations, live updates, and memory usage. Here's what they found[reference:8]:
| Category | Winner |
|---|---|
| Loading speed | SVAR |
| Scrolling | DHTMLX, Bryntum |
| CRUD operations | SVAR |
| Live updates | SVAR |
| Memory efficiency | DHTMLX |
SVAR React Gantt won three out of five categories, making it the fastest React Gantt library in terms of loading, CRUD, and live updates. DHTMLX won memory efficiency and shared first place for scrolling with Bryntum.
What does this mean for you? If your dashboard needs to load quickly and handle frequent task updates (drag-and-drop, progress changes), SVAR is the best choice. If memory usage is your primary concern (perhaps for mobile devices or embedded systems), DHTMLX is the winner. And if smooth scrolling through large timelines is critical, both DHTMLX and Bryntum perform well.
You can run the benchmark yourself using the GitHub repository.
If you're dealing with truly massive datasets—tens of thousands of tasks—the performance strategies we covered in our guide on React charting libraries for large datasets also apply to Gantt charts: virtualization, downsampling, and canvas rendering are your friends.
Decision Framework: Which React Gantt Library Should You Choose?
Here's a practical decision tree:
Are you building a React-first application and want the best performance? → SVAR React Gantt. Native React, MIT-licensed core, PRO upgrade for advanced features.
Do you need a simple, lightweight Gantt chart for a small project? → gantt-task-react or Frappe Gantt. Both are easy to integrate and sufficient for basic timelines.
Do you need enterprise-grade features (critical path, resource leveling, auto-scheduling) and have a budget? → Bryntum Gantt. The most feature-complete option, with the price tag to match.
Do you want a mature library that starts free and scales with your needs? → DHTMLX Gantt Community Edition. MIT-licensed, handles 30k+ tasks, upgrade path to PRO.
Are you already using Syncfusion components? → Syncfusion React Gantt Chart. Seamless integration with the rest of your UI toolkit.
Do you need the absolute best memory efficiency for a constrained environment? → DHTMLX Gantt. It wins the memory benchmark.
If you're still unsure, start with SVAR React Gantt for a new React project. It's the best balance of performance, developer experience, and licensing flexibility. If you outgrow it, you can upgrade to PRO or migrate to a commercial suite.
A Real Story: Choosing a Gantt Library for a Construction Dashboard
A few years ago, I worked on a construction project management dashboard. The client needed to visualize hundreds of tasks across multiple sites—excavation, foundation, framing, electrical, plumbing, inspection. Tasks had dependencies, milestones, and progress tracking. The timeline spanned months.
We started with a custom SVG implementation. It worked for the first month but became unmaintainable as features piled on: drag-to-reschedule, dependency arrows, zoom levels, filtering. We were spending more time on the Gantt chart than on the rest of the application.
We evaluated three options: Bryntum, DHTMLX, and SVAR. Bryntum had every feature we needed but the licensing cost was hard to justify for a mid-sized project. DHTMLX Community Edition was free and mature, but the React wrapper felt bolted on, and we hit performance snags with our largest datasets.
We chose SVAR React Gantt. The native React architecture meant it felt like part of our codebase, not an external widget. The virtualization handled our 500+ tasks smoothly. And the MIT license meant we could start without a procurement battle. We eventually upgraded to PRO for the critical path feature, which was a smooth transition.
The lesson: don't just look at the feature list. Consider how the library integrates with your stack, how it performs with your actual data, and how it fits your budget. A native React component with a clear upgrade path beat a more feature-complete but heavier wrapper for our use case.
Wrapping Up
The React Gantt chart library landscape has matured significantly. You no longer have to choose between a heavy commercial suite and a fragile custom implementation. Open-source options like SVAR React Gantt and gantt-task-react provide excellent foundations, while commercial libraries like Bryntum and DHTMLX offer enterprise-grade features for teams that need them.
My recommendation: start with SVAR React Gantt for any new React project. It's fast, native, TypeScript-ready, and MIT-licensed. If you need advanced scheduling features, upgrade to PRO. If you're building an enterprise application where cost is less of a concern, evaluate Bryntum or DHTMLX based on your specific feature requirements.
And if you're building a broader dashboard, don't miss our guides on the best React chart library for dashboards and React graph libraries. The right visualization stack is more than just a Gantt chart—it's a cohesive set of tools that work well together.
Now go build something that makes project management feel effortless.
Need help building a project management dashboard or integrating a Gantt chart into your React app? Red Surge Technology specializes in data-rich, high-performance interfaces. Get in touch to discuss your project.