 Call us: (732) 520-3386
 Email us: info@redsurgetechnology.com


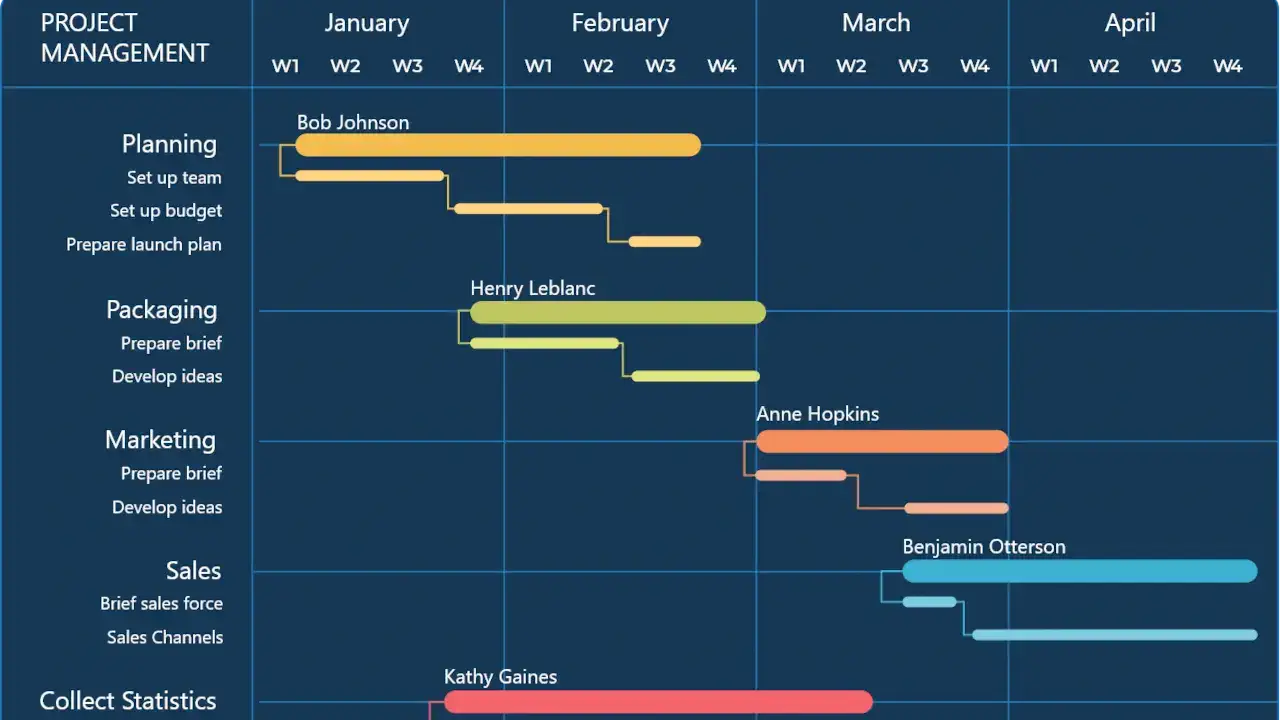
A Gantt chart is one of those components that looks like a table until you try to make it fast. It has a timeline scale, a task grid, dependency arrows, drag-and-drop, and usually a few thousand tasks. Each of those is a rendering concern on its own. Together, they form a performance surface that most React components never have to deal with.
Then you add the features that real project management tools need. Baselines—a shadow bar showing the original plan behind the live bar. In-cell editing—users typing directly into grid columns. Real-time collaboration—multiple people moving tasks on the same chart, seeing each other's changes live. Each of these can quietly reintroduce the re-render problems that virtualization was supposed to solve.
This post is about the performance architecture of a production React Gantt chart. It covers virtualization benchmarks, baseline rendering, in-cell editing without full re-renders, and the WebSocket collaboration patterns that keep multiple users in sync without falling into update loops. If you're still choosing a library, our React Gantt chart library guide covers the landscape. If you want the drag-and-drop tutorial, our React Gantt with drag and drop walkthrough is the hands-on companion.
The Performance Ceiling: Why Gantt Charts Break
Most React Gantt libraries render each task as a DOM row and each timeline bar as a positioned element. At a few hundred tasks, that's fine. At 10,000, the browser is managing tens of thousands of DOM nodes simultaneously—and every drag, scroll, or zoom triggers a reconciliation pass over all of them.
The published benchmarks make the gap concrete. In a comparison of React Gantt libraries, SVAR Gantt reached 100,000 tasks in 1.7 seconds while DHTMLX took nearly 27 seconds for the same dataset[reference:0]. That's not a difference in rendering polish. It's a difference in architecture.
The libraries that scale are the ones that virtualize. SVAR React Gantt uses virtualization for large datasets and dynamic loading of sub-tasks, which keeps the DOM focused on the visible viewport rather than the entire task tree[reference:1]. As of version 2.7, it also virtualizes the Gantt scale itself—only visible time-unit cells are rendered, so a multi-year timeline with hourly resolution can scroll and zoom without lag[reference:2].
That second point matters more than it sounds. Virtualizing the task rows is standard. Virtualizing the timeline scale is the harder problem, because the scale is a dense grid of time units that grows with the timeline length and resolution. Without it, a detailed multi-year chart creates a scale that dwarfs the task list.
Virtualization in Practice: What to Check
If you're evaluating a Gantt library for large datasets, "supports virtualization" is too vague to be useful. These are the specific things that determine whether it actually holds up.
Row virtualization under drag. Does the library keep the virtualized window stable while a task is being dragged? A common failure mode is that dragging a task forces a full row re-render, defeating the virtualization. Test drag performance at your target task count, not just scroll performance.
Scale virtualization. Can the timeline scale render a multi-year range at hourly resolution without creating a DOM node per time unit? SVAR's 2.7 release addressed this specifically[reference:3]. If the library doesn't virtualize the scale, long timelines will stutter regardless of how well the rows are handled.
Dynamic sub-task loading. For hierarchical task trees, does the library load children on expand, or does it load the entire tree upfront? Dynamic loading keeps the initial payload small and the DOM focused on what's expanded[reference:4].
Benchmark at your data volume. Vendor benchmarks are useful for relative comparison, but your dataset has a specific shape—task count, hierarchy depth, dependency density, time range, and scale resolution. Test at that shape before committing. A library that handles 10,000 flat tasks well might struggle with 2,000 deeply nested ones.
Baselines: Rendering Planned vs. Actual Without Doubling the DOM
A baseline is a shadow bar behind the live task bar, showing where the task was originally planned to start and end. It's one of the most useful features in project management software because it makes schedule variance visible at a glance.
The performance trap is obvious: if each task now renders two bars instead of one, you've doubled the element count in the timeline. On a virtualized chart, that's manageable—you're only rendering the visible rows. But the baseline bar has to stay aligned with the live bar, and it has to update when the live bar moves. If the library re-renders the entire baseline layer on every drag, you've lost the virtualization benefit.
The libraries that handle this well treat baselines as first-class task data rather than as an overlay. react-gantt-nl is explicit about this: baseline bars are "first-class citizens, not overlays," using the same coordinate system as task bars for perfect alignment[reference:5]. @bluemillstudio/gantt renders baselines as a shadow bar behind the live bar, with baseline start and end fields on the task model[reference:6].
SVAR's PRO edition includes baselines alongside progress lines and S-curves, and the baseline data is configured via base_start and base_end fields on the task[reference:7][reference:8]. The implementation detail that matters: the baseline should be rendered as part of the same virtualized row as the live bar, not as a separate layer that re-renders independently.
When evaluating baseline performance, test two things: drag a task and confirm the baseline stays aligned without a visible re-render, and zoom the timeline and confirm the baseline scales correctly without falling out of sync.
In-Cell Editing Without Re-rendering the Chart
In-cell editing lets users click a grid cell—task name, start date, duration, assignee—and edit it directly, without opening a modal. It's a significant UX improvement over form-based editing, and it's a significant performance risk.
The risk is that a naive implementation puts the entire task list in React state. Typing a character in a cell updates state, which re-renders the grid, which re-renders the chart, which recalculates every visible task bar. At 1,000 visible rows, that's a frame drop on every keystroke.
The libraries that handle this well isolate the cell's edit state from the chart's render state. SVAR React Gantt added in-cell editing for the task grid in version 2.3, alongside custom HTML for grid cells[reference:9]. The editing state lives in the cell, and the chart only re-renders when the value is committed—not on every keystroke.
If you're building custom in-cell editing on top of a Gantt library, the pattern is the same as any high-frequency input in React: keep the draft value in local component state, commit on blur or Enter, and memoize the chart so it doesn't re-render while the user is typing. Our guide on preventing unnecessary re-renders in React covers the memoization patterns that make this work.
Real-Time Collaboration: WebSockets Without the Update Loop
Multi-user Gantt collaboration is the feature that breaks naive architectures. The sequence is straightforward in principle: User A moves a task, the change is sent to the server, the server broadcasts it to User B, and User B's chart updates. In practice, it's easy to create an infinite loop: the update from the server triggers a local change event, which sends another update to the server, which broadcasts again.
The libraries that support real-time collaboration solve this with an event model that distinguishes local changes from remote changes.
DHTMLX Gantt provides a RemoteEvents helper that opens a WebSocket connection when the Gantt initializes. Local changes go to the server via DataProcessor over REST. The server broadcasts updates to all connected clients over WebSocket, and RemoteEvents applies them to the Gantt without re-triggering the local change handler[reference:10][reference:11].
const { RemoteEvents, remoteUpdates } = gantt.ext.liveUpdates;
const remoteEvents = new RemoteEvents("/api/v1", AUTH_TOKEN);
remoteEvents.on(remoteUpdates);
DHTMLX also publishes a Firebase-based React demo that uses Firestore listeners for real-time sync—every Gantt change is written to Firestore, and every Firestore change is streamed back and applied to the chart[reference:12].
SVAR Gantt added real-time updates from the server in version 2.8, alongside live multi-user editing for React, Svelte, and Vue[reference:13][reference:14]. The implementation follows the same principle: remote updates are applied to the task store without echoing back to the server.
If you're building the collaboration layer yourself, the critical design decision is the echo suppression mechanism. Every update message needs an origin identifier, and the client should ignore updates that originated from its own session. Without this, you'll get feedback loops that are hard to debug and expensive to fix.
The second design decision is conflict resolution. Two users moving the same task simultaneously is rare but possible. The simplest approach is last-write-wins with server timestamps. More sophisticated approaches use operational transforms or CRDTs, but for most project management tools, last-write-wins is sufficient.
If you're comparing WebSocket and Server-Sent Events for the collaboration transport, our WebSocket vs SSE guide covers the tradeoffs. For most Gantt collaboration, WebSocket is the right choice because updates flow in both directions.
A Real Story: The Collaboration Loop That Took Down a Demo
A team I worked with built a collaborative Gantt chart on top of a React Gantt library and a custom WebSocket server. The single-user experience was fast. The two-user demo was not.
When User A moved a task, User B's chart updated correctly—and then User A's chart updated again, and then User B's chart updated again. The task oscillated between two positions. Within a few seconds, the server was flooded with update messages.
The bug was classic echo: User B's chart applied the remote update through the same handler that handled local drag events, which sent the change back to the server, which broadcast it again. The fix was to tag every update with the originating client ID and ignore updates where the origin matched the current client.
The performance lesson was separate but equally important. Even after fixing the loop, the chart re-rendered the entire task list on every remote update. At 2,000 tasks, a single remote change caused a visible stutter. The fix was to apply remote updates at the task level—find the changed task by ID, update its attributes in the store, and let the virtualized row re-render individually. The chart didn't need to re-render; only the affected row did.
Both fixes were architectural, not library-specific. The library provided the hooks; the application had to use them correctly.
Decision Framework: What to Look For
Here's the checklist I use when evaluating a React Gantt library for production performance.
Virtualization:
- Row virtualization at your target task count, tested under drag.
- Scale virtualization for long timelines at high resolution.
- Dynamic sub-task loading for hierarchical task trees.
Baselines:
- Baseline bars rendered in the same coordinate system as live bars.
- Baseline alignment maintained during drag and zoom.
- Baseline fields modeled on the task, not as a separate overlay layer.
In-cell editing:
- Editing state isolated from chart render state.
- Commit-on-blur or commit-on-enter, not commit-on-keystroke.
- Custom cell renderers that don't force full row re-renders.
Real-time collaboration:
- Remote updates distinguished from local updates.
- Echo suppression by client ID.
- Task-level updates, not full-list re-renders.
- A documented server protocol (WebSocket, Firebase, or REST + WebSocket).
Benchmarks:
- Vendor benchmarks at 10k and 100k tasks.
- Your own dataset tested at your actual volume and shape.
- Drag, scroll, zoom, and remote-update performance measured separately.
Wrapping Up
React Gantt performance is an architecture problem, not a styling problem. The libraries that scale virtualize both the task rows and the timeline scale. The ones that handle baselines well render them as task data, not overlays. The ones that support in-cell editing isolate the edit state from the chart render state. And the ones that support real-time collaboration suppress echoes and apply updates at the task level.
The published benchmarks are a useful starting point—SVAR Gantt reaching 100,000 tasks in 1.7 seconds versus DHTMLX's 27 seconds is a meaningful signal[reference:15]. But your dataset has a specific shape, and the only benchmark that matters is the one you run against your own data.
For the library comparison, see our React Gantt chart library guide. For the drag-and-drop implementation, our React Gantt with drag and drop tutorial covers the hands-on side. And for the real-time transport layer, our WebSocket vs SSE comparison covers the protocol choice.
Now go benchmark your Gantt chart at 10,000 tasks before you ship it.
Need help building or optimizing a high-performance Gantt chart for a project management application? Red Surge Technology specializes in complex, data-heavy React interfaces. Get in touch to discuss your project.