 Call us: (732) 520-3386
 Email us: info@redsurgetechnology.com



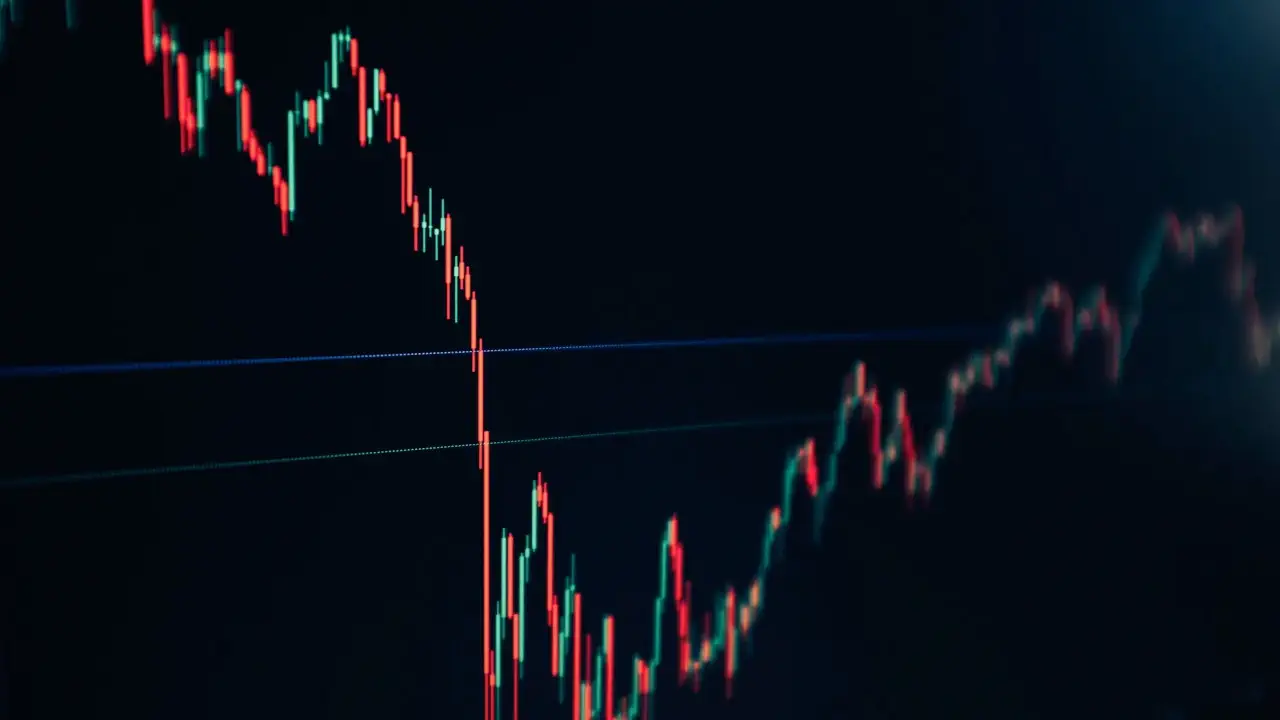
Building a financial dashboard is not like building a generic analytics dashboard. A line chart showing revenue over time is one thing. A candlestick chart showing open, high, low, and close prices with technical indicators, volume bars, crosshair interactions, and real-time streaming updates is a completely different beast. The rendering requirements, the data structures, the interaction patterns—they're all specialized.
I've built trading interfaces and financial dashboards for clients in fintech and investment management. The chart library you choose early on shapes everything: how you handle real-time data, how you render thousands of candles without dropping frames, how you implement technical indicators. Picking a generic chart library like Recharts and trying to fake a candlestick chart is a path to frustration. You need a tool built for financial data.
This guide covers the best React stock chart libraries in 2026, evaluated specifically for financial use cases. If you've been working through our React chart library comparison, you know the general landscape. But stock charts have their own ecosystem, and the best options here are often not the ones that dominate generic charting.
What Makes a Stock Chart Library Different
Before we dive in, let's clarify what separates a stock chart library from a general chart library.
Chart types. Stock charts need candlestick, OHLC (open-high-low-close), HiLo, and Heikin Ashi chart types. A line chart library can't draw a candlestick without significant custom work.
Data density. A single trading day might have 1,440 one-minute candles. A year of data can easily exceed 100,000 points. The library must handle that volume without lag.
Real-time updates. Price data streams in constantly. The chart needs to update efficiently—appending new candles, updating the last candle's close, without re-rendering the entire chart.
Technical indicators. Moving averages, RSI, MACD, Bollinger Bands. These are calculated from price data and overlaid on the chart. Some libraries include them built-in; others require manual calculation.
Financial interactions. Crosshairs that show OHLC values at the hovered timestamp. Zooming and panning through time. Range selectors. Drawing tools for trend lines and Fibonacci retracements.
Volume and sub-charts. Stock charts almost always include a volume histogram beneath the price chart. More advanced setups have multiple panes for indicators.
If you're dealing with truly massive datasets—millions of ticks—the strategies we covered in our React charting library for large datasets guide also apply here. But stock charts have their own performance profile because of the real-time and interaction requirements.
TradingView Lightweight Charts: The Performance Benchmark
TradingView's Lightweight Charts is the most popular open-source financial charting library for React, and for good reason. It's built specifically for financial data, uses HTML5 canvas rendering, and is incredibly lightweight compared to full-featured commercial alternatives.
What sets it apart:
- Canvas rendering. One canvas element for the entire chart. Handles large datasets efficiently.
- Small bundle size. Around 45 KB gzipped. For comparison, Highcharts Stock is several times larger.
- Candlestick, OHLC, line, area, and bar series. All the chart types you need for financial data.
- Real-time updates. Efficient
series.update()method for streaming data, as opposed to fullsetData()calls. - Crosshair and tooltip. Built-in crosshair that shows OHLC values at the hovered point.
- TypeScript support. Written in TypeScript, with full type definitions.
- Free and open-source. Apache 2.0 license. No commercial restrictions.
The React integration requires a small amount of boilerplate because Lightweight Charts is a vanilla JavaScript library. You create the chart in a useEffect, store the chart instance in a ref, and clean up on unmount.
import { createChart, CandlestickSeries } from "lightweight-charts";
import { useEffect, useRef } from "react";

function StockChart({ data }) {
  const chartContainerRef = useRef();
  const chartRef = useRef();

  useEffect(() => {
    const chart = createChart(chartContainerRef.current, {
      width: chartContainerRef.current.clientWidth,
      height: 400,
    });
    chartRef.current = chart;

    const candleSeries = chart.addSeries(CandlestickSeries, {
      upColor: "#26a69a",
      downColor: "#ef5350",
    });
    candleSeries.setData(data);

    return () => chart.remove();
  }, []);

  return <div ref={chartContainerRef} />;
}
There are community React wrappers that simplify this further, like @ukorvl/lightweight-charts-react-components, but the vanilla integration is straightforward enough that many teams skip the wrapper.
What to watch out for: Lightweight Charts is intentionally minimal. It doesn't include technical indicators, drawing tools, or advanced annotations out of the box. You either calculate indicators yourself and add them as line series, or you use TradingView's commercial Advanced Charts product. If you need a full-featured trading interface, Lightweight Charts is the foundation, not the complete solution.
When to choose it: You're building a custom financial dashboard and want maximum performance with minimal bundle size. You're comfortable calculating indicators and implementing interactions yourself. It's the best choice for most React stock charting needs.
Highcharts Stock: The Feature-Rich Veteran
Highcharts has been around for over a decade and its Stock product is one of the most feature-complete financial charting libraries available. The @stackline/react-highcharts package provides a maintained React 19 wrapper with native chart instance access and controlled update modes[reference:0].
What sets it apart:
- Comprehensive feature set. Candlestick, OHLC, HiLo, line, area, column, and more. Built-in technical indicators including SMA, EMA, MACD, RSI, Bollinger Bands, and dozens more.
- Range selector and navigator. The familiar timeline scrubber at the bottom of the chart. Users can zoom into specific date ranges.
- Annotations and drawing tools. Trend lines, Fibonacci retracements, and text annotations.
- Real-time streaming. Efficient updates for live data, with the wrapper supporting series-data update mode for realtime charts[reference:1].
- Excellent documentation and support. Highcharts has one of the best-documented APIs in the charting space.
- React 19 compatibility. The Stackline wrapper is actively maintained with versioned packages for React 17, 18, and 19[reference:2].
What to watch out for: The licensing. Highcharts is free for personal and non-commercial use, but commercial applications require a paid license. The bundle size is also substantial—Highcharts Stock is several times larger than Lightweight Charts. For simple dashboards where you don't need the full feature set, it's overkill.
When to choose it: You need built-in technical indicators, drawing tools, and a range selector without building them yourself. Your budget allows for the commercial license. The development speed you gain from the feature set often justifies the cost.
AG Charts: The Modern Canvas Contender
AG Charts is a relatively newer entrant from the team behind AG Grid. It's a canvas-based charting library with a dedicated Financial Charts product featuring advanced annotations and a toolbar[reference:3].
What sets it apart:
- Financial Charts product. Candlestick, hollow candlestick, OHLC, line, step line, HLC, and high-low series types[reference:4].
- Advanced annotations. Users can add trend lines, Fibonacci retracements, and text annotations directly on the chart.
- Toolbar. A built-in toolbar for chart interactions and analysis tools[reference:5].
- Canvas rendering. No third-party dependencies, excellent performance[reference:6].
- Community and Enterprise editions. The community edition is MIT-licensed and includes core series types. The enterprise edition adds financial charts and advanced features[reference:7].
import { AgFinancialCharts } from "ag-charts-react";
import "ag-charts-enterprise";

function StockChart() {
  const options = {
    data: stockData,
    series: [
      {
        type: "candlestick",
        xKey: "date",
        openKey: "open",
        highKey: "high",
        lowKey: "low",
        closeKey: "close",
      },
    ],
  };

  return <AgFinancialCharts options={options} />;
}
What to watch out for: The Financial Charts feature is part of the Enterprise edition, which requires a commercial license. The React wrapper is less mature than Highcharts' but is actively developed. The API is different from both Lightweight Charts and Highcharts, so there's a learning curve.
When to choose it: You want a modern, canvas-based charting library with financial chart types and annotations, and you're willing to pay for the Enterprise edition. It's a strong alternative to Highcharts Stock for teams that prefer AG Grid's ecosystem.
Syncfusion React Stock Chart: The Enterprise Suite Option
Syncfusion's React Stock Chart is part of their larger UI component suite. It's a commercial product, though Syncfusion offers a free community license for small companies and individual developers.
What sets it apart:
- Built-in technical indicators. Moving averages, RSI, MACD, Bollinger Bands, and more.
- Range and period selectors. Users can select time ranges and periods with built-in UI controls[reference:8].
- Stock events. Display market events like earnings, dividends, and splits directly on the chart[reference:9].
- Multiple chart types. Candlestick, OHLC, HiLo, and more[reference:10].
- Responsive and mobile-friendly. Optimized for desktop, tablet, and phone[reference:11].
- Theming. Fluent, Tailwind CSS, Bootstrap, Material, and Fabric themes built-in[reference:12].
What to watch out for: The React wrapper is less performant than native React components like Lightweight Charts. The licensing cost can be high for larger teams, though the community license is generous. If you're not already using Syncfusion components, the integration overhead may not be worth it.
When to choose it: You're already using Syncfusion components in your React application, or you need a Microsoft Project-like experience with a familiar API. The built-in indicators and stock events save development time.
react-stockcharts (and Its Forks): The Legacy Option
react-stockcharts was once the go-to React stock chart library. It's built with React and D3, supports canvas and SVG rendering, and includes over 60 technical indicators and drawing tools[reference:13].
The problem is that the original project is unmaintained. The last significant update was years ago, and it doesn't support React 18 or 19. However, community forks have emerged to fill the gap:
- react-financial-charts – A fork of react-stockcharts, renamed, converted to TypeScript, and with bug fixes applied[reference:14].
- react-19-financial-charts – A more recent fork specifically targeting React 19 compatibility.
These forks keep the library alive, but they're community-maintained and may not have the same level of support as commercial alternatives.
When to choose it: You're maintaining an existing project that already uses react-stockcharts, or you need its specific indicator set and are comfortable with a community fork. For new projects, I'd recommend Lightweight Charts or Highcharts Stock instead.
Comparison Table: React Stock Chart Libraries
| Library | Rendering | Bundle Size | Chart Types | Indicators | License | Best For |
|---|---|---|---|---|---|---|
| TradingView Lightweight Charts | Canvas | ~45 KB | Candlestick, OHLC, Line, Area, Bar | Manual | Apache 2.0 | Custom dashboards, performance-critical |
| Highcharts Stock | SVG/Canvas | ~150 KB | Candlestick, OHLC, HiLo, Line, Area | 60+ built-in | Commercial | Feature-complete trading interfaces |
| AG Charts Financial | Canvas | ~100 KB | Candlestick, OHLC, HLC, Line, Step | Built-in | Commercial (Enterprise) | Modern canvas with annotations |
| Syncfusion Stock Chart | SVG | ~200 KB | Candlestick, OHLC, HiLo | Built-in | Commercial | Enterprise suites already using Syncfusion |
| react-stockcharts (forks) | Canvas/SVG | ~120 KB | Candlestick, OHLC, Line, Area | 60+ built-in | MIT | Legacy projects, community forks |
If you're dealing with truly massive datasets—millions of ticks or years of minute-level data—the performance strategies from our React charting library performance benchmarks become essential. Canvas rendering is non-negotiable at that scale.
Decision Framework: Which React Stock Chart Library Should You Choose?
Here's the decision tree I use when advising teams:
Are you building a custom dashboard and want maximum performance with minimal bundle size? → TradingView Lightweight Charts. It's the best balance of speed, simplicity, and cost. You'll calculate indicators yourself, but the performance is unbeatable.
Do you need built-in technical indicators, drawing tools, and a range selector? → Highcharts Stock. The feature set justifies the commercial license for most teams. The React wrapper is well-maintained.
Are you already using AG Grid and want a cohesive ecosystem? → AG Charts Financial. The canvas rendering is modern, and the annotations are excellent. The Enterprise license is required for financial charts.
Are you already using Syncfusion components? → Syncfusion React Stock Chart. The integration with the rest of the Syncfusion suite is seamless.
Are you maintaining a legacy project that already uses react-stockcharts? → A community fork like
react-financial-chartsorreact-19-financial-charts. Don't migrate unless you have a compelling reason.Do you need the absolute most feature-complete solution and budget is not a concern? → Highcharts Stock or Syncfusion. Both offer enterprise-grade support and comprehensive feature sets.
For most React teams starting a new financial dashboard, I recommend starting with TradingView Lightweight Charts. It's free, fast, and covers the core charting needs. If you find yourself building too many custom features, upgrade to Highcharts Stock or AG Charts Financial.
A Real Story: Building a Trading Dashboard with Lightweight Charts
A few years ago, I worked on a trading dashboard for a fintech startup. The requirements were ambitious: real-time candlestick charts for multiple symbols, technical indicators (SMA, EMA, RSI, MACD), drawing tools for trend lines, and a watchlist with live price updates. The initial budget was tight—no room for expensive commercial licenses.
We started with a generic chart library and tried to build candlestick rendering ourselves. It was a disaster. The performance was terrible with more than a few hundred candles, and implementing crosshair interactions was a nightmare.
We evaluated Lightweight Charts and Highcharts Stock. Highcharts had everything we needed out of the box, but the licensing cost was a dealbreaker for the startup's budget. Lightweight Charts was free, fast, and lightweight.
We went with Lightweight Charts and built the indicators ourselves. It took about two weeks to implement SMA, EMA, RSI, and MACD as line series. The drawing tools took another week. But the result was a dashboard that rendered 50,000 candles smoothly, updated in real time without stuttering, and had a bundle size under 100 KB.
The lesson: if you have the development resources, Lightweight Charts gives you the performance and flexibility of a custom solution without the licensing cost. If you don't have the resources, Highcharts Stock is worth the investment.
Performance Considerations for Stock Charts
Stock charts have unique performance challenges. Here's what to keep in mind:
Canvas is almost always the right choice. SVG stock charts choke on thousands of candles. Canvas renders everything to a single element, which handles large datasets far better. All the libraries in this guide use canvas except Syncfusion.
Use series.update() for real-time data. Instead of calling setData() with the entire dataset on every tick, use the update method to change only the last candle or append a new one. This is dramatically faster.
Limit the number of visible points. Even with canvas, rendering 100,000 candles on screen is wasteful. Users can't perceive individual candles at that density. Downsample or aggregate for higher timeframes.
Debounce indicator calculations. Technical indicators can be expensive to compute. If you're recalculating on every tick, you're wasting CPU. Throttle or debounce the calculations, as we covered in our JavaScript debounce vs throttle guide.
Memoize chart components. Wrap your chart component in React.memo and ensure props are stable. This prevents unnecessary re-renders when the parent component updates.
If you're building a dashboard with multiple charts, the strategies in our best React chart library for dashboards guide apply here too. Stock charts are just one piece of a larger dashboard puzzle.
Community Resources and Further Learning
The financial charting community is active but niche. Here are the resources I've found most valuable:
- GitHub – financial-charts topic (https://github.com/topics/financial-charts) — A curated list of financial charting libraries and tools, including many TypeScript and React options[reference:15].
- r/reactjs on Reddit (https://www.reddit.com/r/reactjs/) — Discussions about stock chart libraries and trading dashboards appear regularly.
- dev.to (https://dev.to/t/react) — Tutorials and case studies on React financial charting.
- Quantitative Finance Stack Exchange (https://quant.stackexchange.com/) — For questions about financial data visualization and analysis.
- TradingView Lightweight Charts documentation (https://tradingview.github.io/lightweight-charts/) — Excellent docs with React examples.
- Highcharts Stock API reference (https://api.highcharts.com/highstock/) — Comprehensive API documentation.
Wrapping Up
The React stock chart library ecosystem has matured significantly. TradingView Lightweight Charts provides a fast, free foundation for custom dashboards. Highcharts Stock offers a feature-complete solution for teams that need built-in indicators and tools. AG Charts Financial brings modern canvas rendering with annotations. Syncfusion and the react-stockcharts forks serve specific use cases.
The right choice depends on your budget, your performance requirements, and how much custom development you're willing to do. For most teams, I recommend starting with Lightweight Charts and upgrading to Highcharts Stock if the feature set justifies the cost.
If you're building a broader financial dashboard, don't miss our guides on React chart libraries for dashboards and React charting library performance benchmarks. The right visualization stack is more than just a stock chart—it's a cohesive set of tools that work well together.
Now go build something that makes financial data beautiful and fast.
Need help building a financial dashboard or integrating stock charts into your React app? Red Surge Technology specializes in data-rich, high-performance interfaces for fintech and investment platforms. Get in touch to discuss your project.